Projects: Tom Baumgartner & Scott Bennett


Creating the Canvas: A collaboration between Scott Bennett and Tom Baumgartner


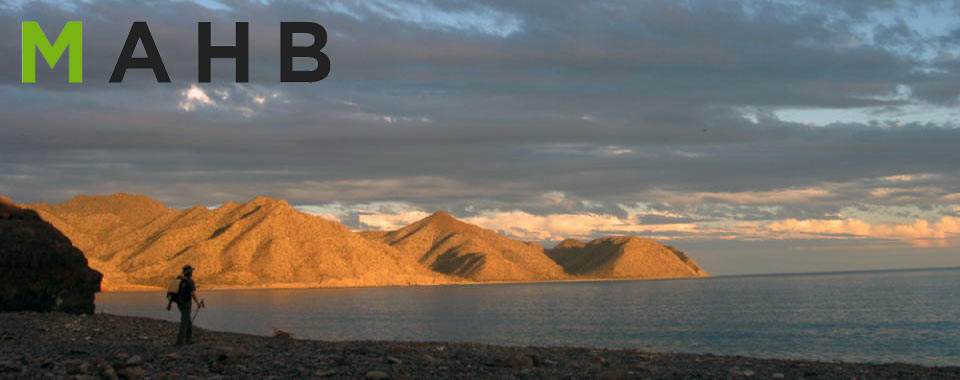
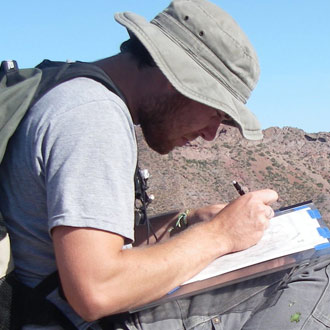
Image courtesy of Scott Bennett

Baumgartner, Tom, Bennett, Scott, Gavenus, Erika | June 15, 2017

Over the past weeks, the MAHB has had the pleasure of sharing the incredible collaborative work being created by the teams of 6&6. Forged by the Next Generation Sonoran Desert Researchers network (N-Gen, www.nextgensd.com), 6&6 is a collaboration between artists and scientists to explore the patterns and processes of the Sonoran Desert and Gulf of California. The MAHB has shared the partnerships of:

  • Ben Wilder and Ben Johnson, working to present the multi-layered story of the pozos, or fresh-water springs, in northwestern Mexico’s Grand Desierto and consider how our relationship to water has changed.
  • Chip Hedgcock and Mark A. Dimmitt, presenting the diaphanous plants of the Sonoran Desert and their unique sparseness through lumen printing.
  • Heather Green and Taylor Edwards, featuring the chuckwalla of La Cholla and how isolation has become its reality.
  • Eric Magrane and Maria Johnson, bringing attention to the by-catch of the shrimp trawling fishery in Mexico’s Gulf of California through illustration, poetry, video, and installation.
  • Kathleen Velo and Michael Bogan, finding ways to combine Kathleen’s underwater photogram work with Michael’s aquatic ecology research on desert freshwater communities.

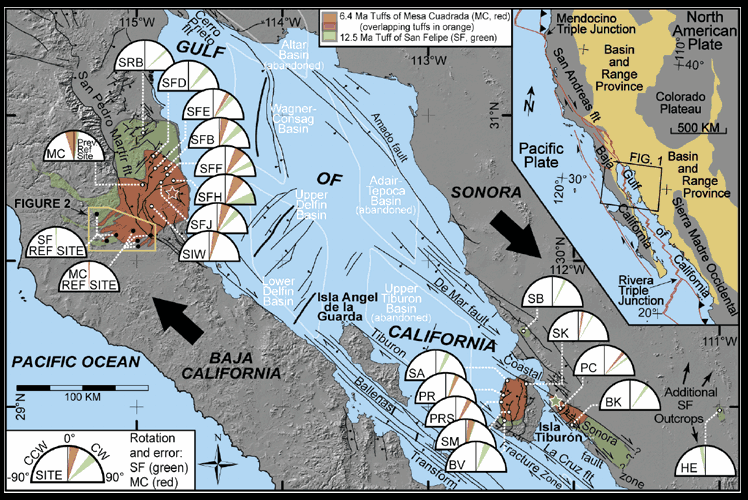
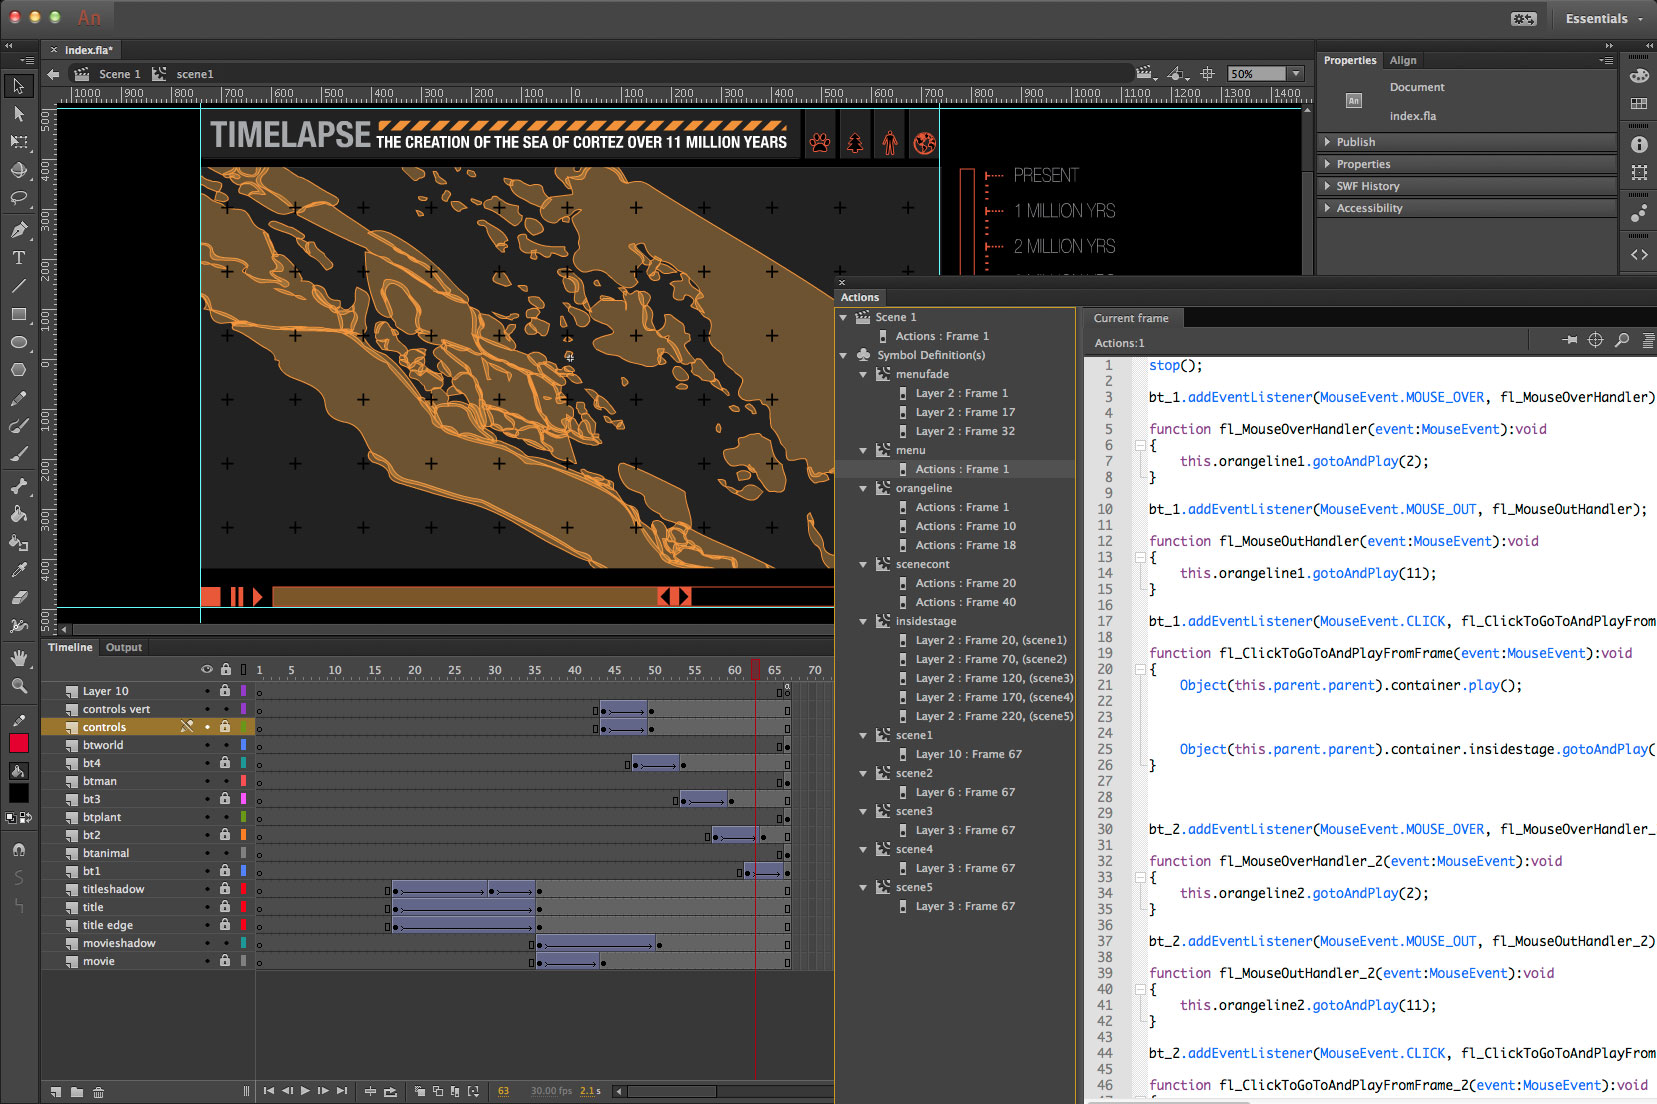
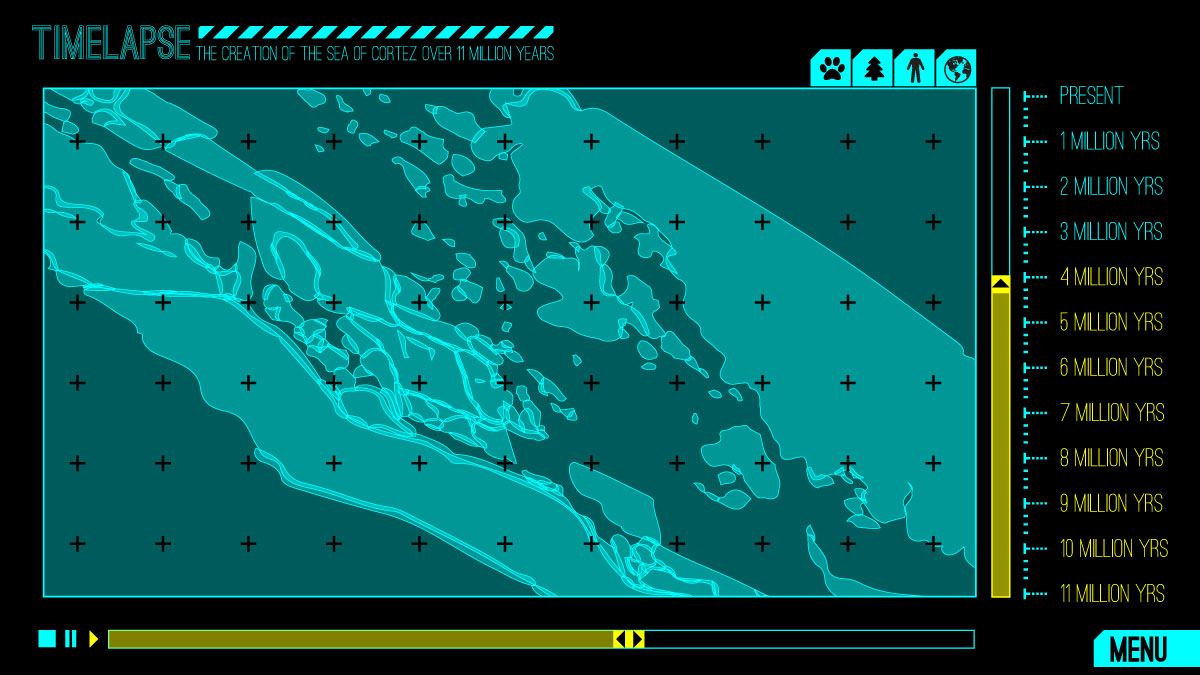
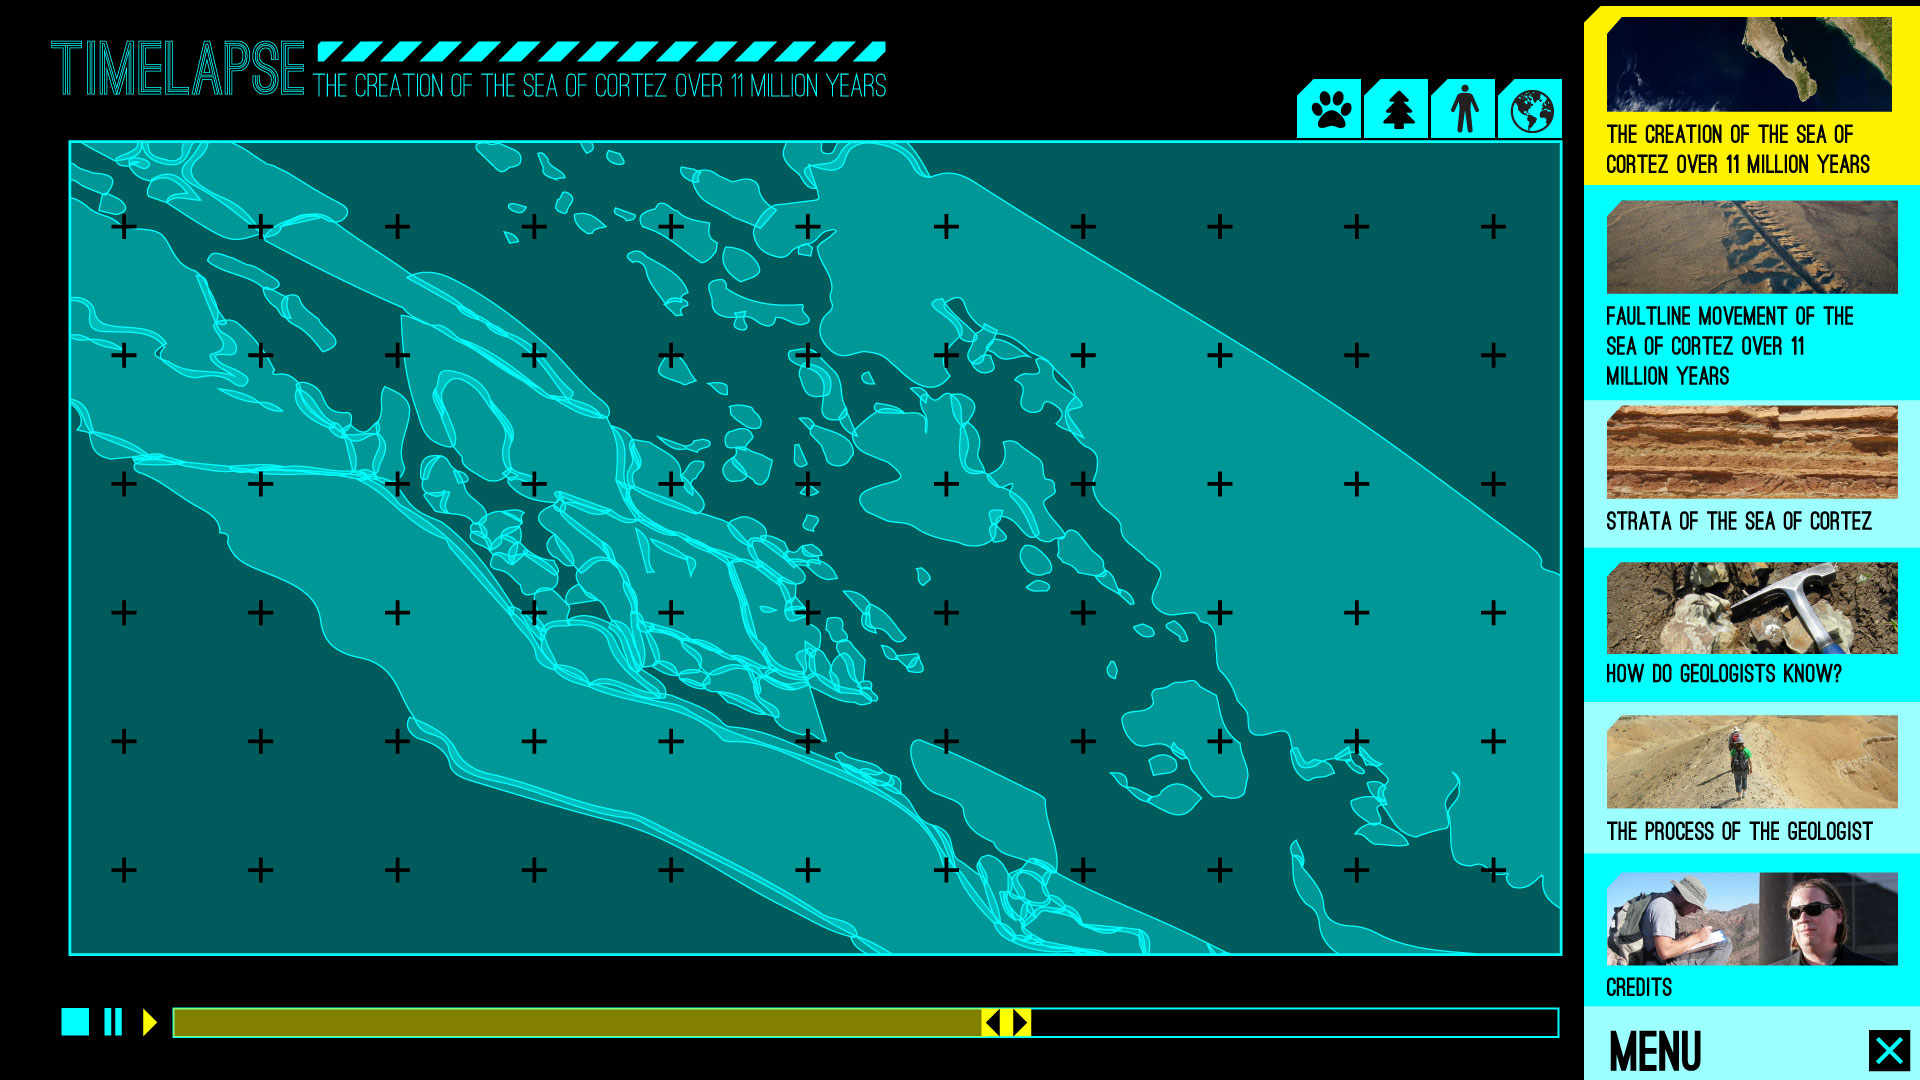
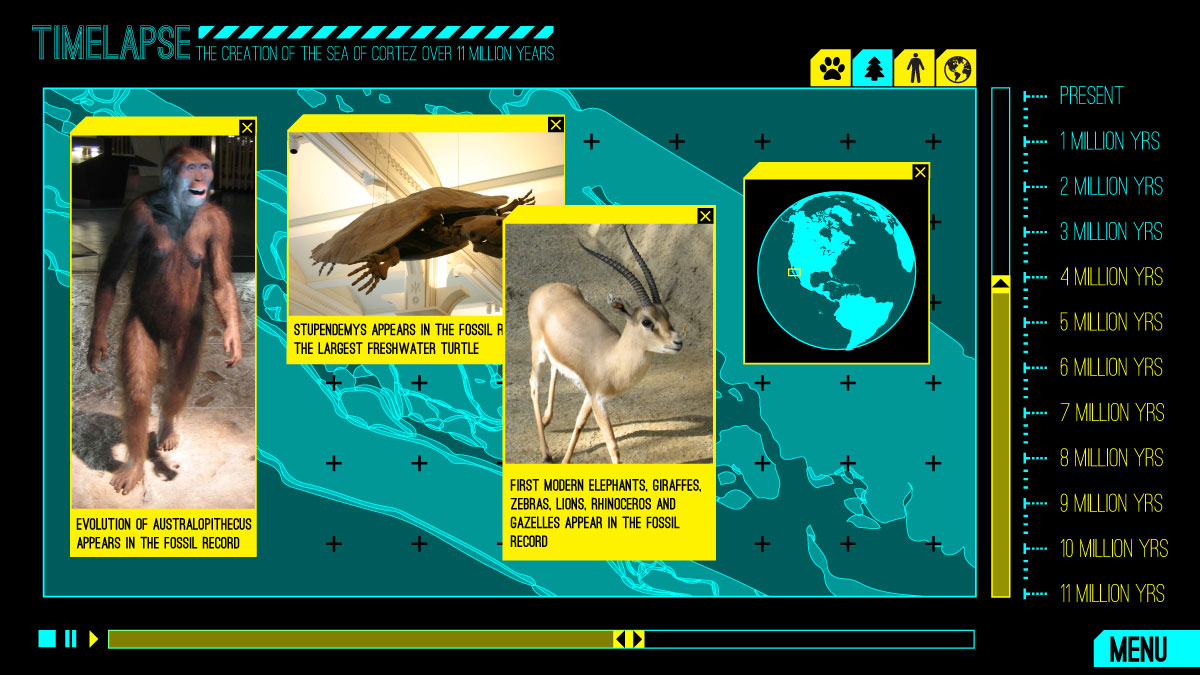
This week we are highlighting the final team, Scott Bennett and Tom Baumgartner, who are creating the canvas upon which these other projects are positioned. Bennett is a field geologist working with the USGS and Baumgartner is an artist with extensive experience in data visualization and illustration. Together they are creating artistic renderings of how the physical landscape of the Gulf of California evolved through time — over the past 11 million years. In a project aiming to explore the patterns and processes of the Sonoran Desert and Gulf of California, Bennett and Baumgartner’s work provides a sense of how those patterns came to be –the geologic and plate tectonic forces behind the isolated mountains of La Cholla, the critical existence of the pozos, the rich marine resources of the Gulf, and even the desert itself. Baumgartner explains, “We’re going to step back in time and show not only the movement of different land masses but also the topography.”

Read more


Course Correction


Collaborations, especially ones involving long-term projects, will take unexpected twists and turns. Sometimes these changes put you on a better path. For the sake of fitting into the project as a whole as well as working within given resources, Scott and I have made a course correction.

The new direction will be 6 pieces, inked, digitally colorized and printed for display in 6 separate light boxes. 6 moments in time derived from one of 11 million years in Scott's research showing the creation of the Gulf of California. Geologic data can show where and when landforms were in the past but can only guess at the topological aspects during that time. Using hints from present topological maps and the work of paleogeography scientists like Ron Blakey we'll try to approximate what the terrain looked like millions of years ago.


In December, the group took a tour of the The University of Arizona Museum of Art to get a feel for the space and to solidify things with the museum director and curator. This also put a timeline into perspective. The show will open in December of 2018. This works well for Scott and I since in a way, we are just starting out on the project.


Skeleton and Redesign

Recent developments:

  • a redesign of the interface to have a more contemporary museum aesthetic
  • the discovery of Adobe Animate touchscreen SDK from Open Exhibits which will save more of the coding effort we discussed in the last post
  • beginning skeleton of the app in desktop mode to work out user experience before coding for touchscreens

"Skeleton" is a term used for a website or application that has basic navigation, look and feel but no content. Click on the "View Demo" image to see the working skeleton.

Javascript and Touchscreen Experiments

Sometimes the research going into a project isn't as interesting as dreaming it up or seeing the finished product. Our goal is to display Scott's animated map of the creation of the Sea of Cortez in a way that's pausible, zoomable and spinnable using only your fingers on a touchscreen. We want this to work primarily in the gallery but it would be nice if it had a life on the internet too.

An interactive touchscreen application requires coding, testing and more testing. Touchscreens are not all the same and the code that makes them work when you touch and drag, use two fingers or just press/hover are accepted by some devices and not by others. The most accessible and accepted coding to make this possible is Javascript and HTML5. Javascript writers will create libraries of custom coding they hope will take on widespread use. We are using CreateJS and HammerJS (as in MC) libraries. Coders are constantly updating these libraries with help from the community. HTML5 was outlined 10yrs ago but parts of it are still being written and then supported by browsers. So web tech is ever-growing and changing.

Here is Tom testing a large wall hung touchscreen with a simple animation. (Our thanks to Ridgewood Interactive Communications) It's a little laggy but this screen is running off a small android device. Not too big of a graphics card on your phone.

Here's an example Tom built that works on a touchscreen (works better in Chrome). It includes some code to simulate touch on a desktop. Use SHIFT with your mouse and you'll get the two finger zoom effect you get on an ipad:

Zoom Drag Spin Example

Here's a manual version:

Manual Zoom Drag Example

Outlining the Touch Screen Application


Scott Bennett and Tom Baumgartner meet through Google Hangouts

Scott currently resides in Seattle where he works for the USGS so we meet via Google Hangouts so we can talk and share files on screen. In our last meeting we outlined the project which will be a large touchscreen table that can be interacted with like a giant iPad. Navigation will guide you through 5 separate vignettes. Animations can be controlled manually by sliding a finger, rotated or zoomed, and points of interest tabs will appear that will open up additional infographics/photos in relation to the timeline.

The 'App' will involve 5 vignettes:

  • Main animation of the creation of the Sea of Cortez from 11 million years ago to the present.
  • A version of the main animation that highlights the movement of faultlines during that time period.
  • A "WebGL" section of the area's layered strata. Users can rotate the 'brick' to examine the layers.
  • A "How do we know?" section that will explain how geologists can track rock through time. IE rocks have a magnetism in relationship to the poles when they are born.
  • A "What do geologists do all day" section that explains a geologist's career as well as everyday tasks.

Presently, Scott is gathering the electronic files of his research and animations for use in the 'App.' Tom is building a library of graphics and javascript code for use in the 'App.'

Below are rough mockups of the main animation, the side-drawer menu, and an example of draggable popup info windows:


More Articles ...

  1. Initial Ideas